 |
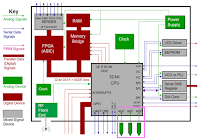
| Figure 1: A generic IoT block diagram shows serial-data links in blue |
In our ongoing review of debugging serial-data standards for Internet of Things (IoT) devices, let's now turn to three more popular protocols: Ethernet, SATA, and PCIe. Ethernet is found in computer networking applications, while the Serial Advanced Technology Attachment (SATA) connects host bus adapters to mass-storage devices. The Peripheral Component Interconnect Express (PCI Express or PCIe) handles communication between root complexes (motherboards) and expansion-card interfaces.
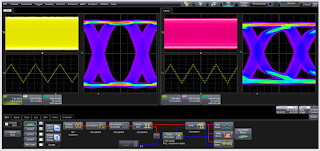
Figure 2 shows an oscilloscope screen capture of a real-world example; here, we're trying to pin down a SATA digital encoder issue related to spread-spectrum clocking (SSC). On the right side is an eye diagram of the SSC that
 |
| Figure 2: An SSC track demodulator helped diagnose the digital encoder issue in this SATA SSC signal |
was extracted from the data stream. This signal, shown in the Lane 2 tab through use of an SSC track demodulator, has a stair-step function stemming from very abrupt changes in the SSC modulation. That wave shape proved to be the cause of the encoder issue. The SSC function should look like the one at left in the Lane 1 tab, with a smoother triangle wave shape.
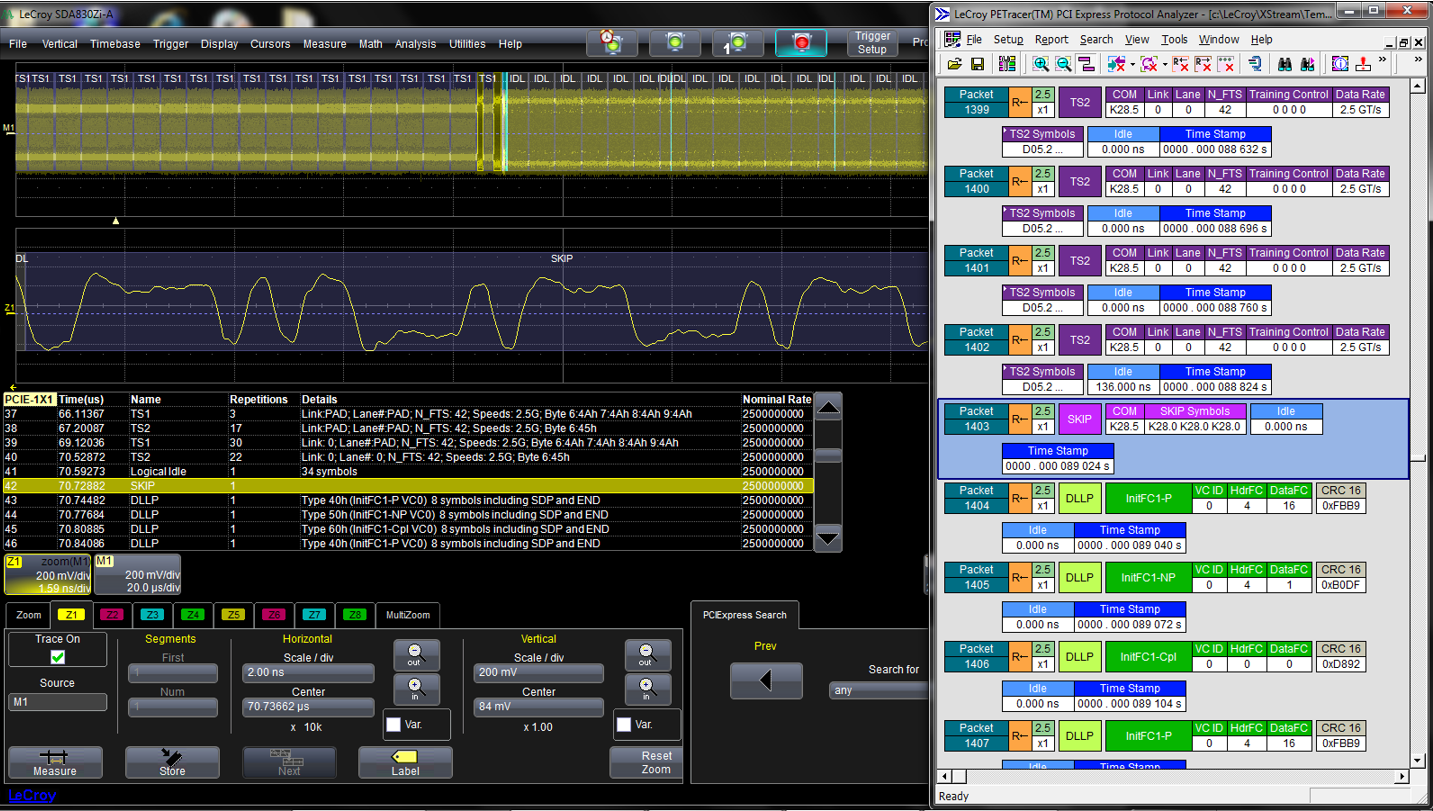
The ability to examine the protocol view and physical layer at the same time is a valuable tool in debugging IoT serial-data functionality. The screen capture of Figure 3 shows a PCIe signal acquisition at left with the protocol-analysis view at
right. Touching any point in the protocol-analyzer view will link to that same point in time in the waveform. Note that while Figure 3 depicts an example of a x1 link, Teledyne LeCroy's ProtoSync software option currently supports simultaneous views of physical-layer waveforms, decode annotation overlays, and protocol analysis views for PCIe lane/direction combinations of 1x1, 1x2, and 4x1 for all PCIe generations up to 4.0.
 |
| Figure 3: Time-correlated waveform and protocol views help identify problem areas in a PCIe serial-data stream |
If the protocol analyzer shows a protocol error, touching that item brings you to that exactly where the error occurred in the acquisition waveform. Maybe the cause is a non-monotonic edge, or a rise time that's slow enough to have been misinterpreted. It could be a glitch, runt, or ringing. But whatever the cause, the time-correlated waveform and protocol views will isolate the problem.
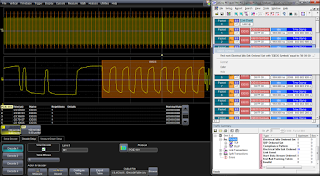
In another example of PCIe protocol debugging, the IoT device was erroneously sending an electrical idle exit ordered set (EIEOS) link-layer message on a regular interval. An EIEOS is part of a PCIe channel's power-management protocol, telling the channel to exit the L0 Standby state and return to L0 status. In Figure 4, these messages appear in the acquisition waveform at top left as the red-striped elements, one of which appears in the zoom trace at center left. The protocol analyzer tells us that there were 84 instances of the EIEOS packet being sent.
 |
| Figure 4: A device malfunction is identified here at the PCIe protocol layer |
Similarly, the time-correlated waveform and protocol views can aid in monitoring Ethernet traffic, such as video signals from a security camera. Compliance mask testing is another important tool for Ethernet debugging.
Next time, we'll conclude our survey of IoT device debug with some observations regarding DDR memory.
Source : https://blog.teledynelecroy.com/2018/05/debugging-ethernet-sata-and-pcie-for.html